The World Bank has updated the methods it uses to measure incomes and poverty around the world. What does this mean for our understanding of global poverty?
To track progress towards its goal of eradicating extreme poverty by 2030, the UN relies on World Bank estimates of the share of the world population that fall below the International Poverty Line.
In September 2022, the figure at which this poverty line is set shifted from $1.90 to $2.15. This reflects a change in the units in which the World Bank expresses its poverty and inequality data – from international dollars given in 2011 prices to international dollars given in 2017 prices.
In this article we consider what the World Bank’s revised methodology means for our understanding of global poverty. We then also explain the updated methodology: what international dollars are, what the change to 2017 prices mean, and how this change affects the International Poverty Line and the World Bank’s poverty estimates.
How does the updated International Poverty Line affect our understanding of global poverty?
The crucial fact to know about the World Bank’s updated International Poverty Line is that, whilst the number has risen – from $1.90 to $2.15 per day – in terms of the goods and services that it affords, the value is broadly the same.
This is because the units in which the old and new figures are counted have changed: the $1.90 figure was expressed in 2011 international-$, and the new figure of $2.15 is expressed in 2017 international-$.
Below we explain in much more detail what international dollars are and what the change in base year means. But broadly speaking, the difference in the two units reflects inflation over time: Because prices have gone up, one 2017 international-$ buys a smaller quantity of goods and services than one 2011 international-$. This leaves the real value of the revised International Poverty Line broadly equal to what it was before.
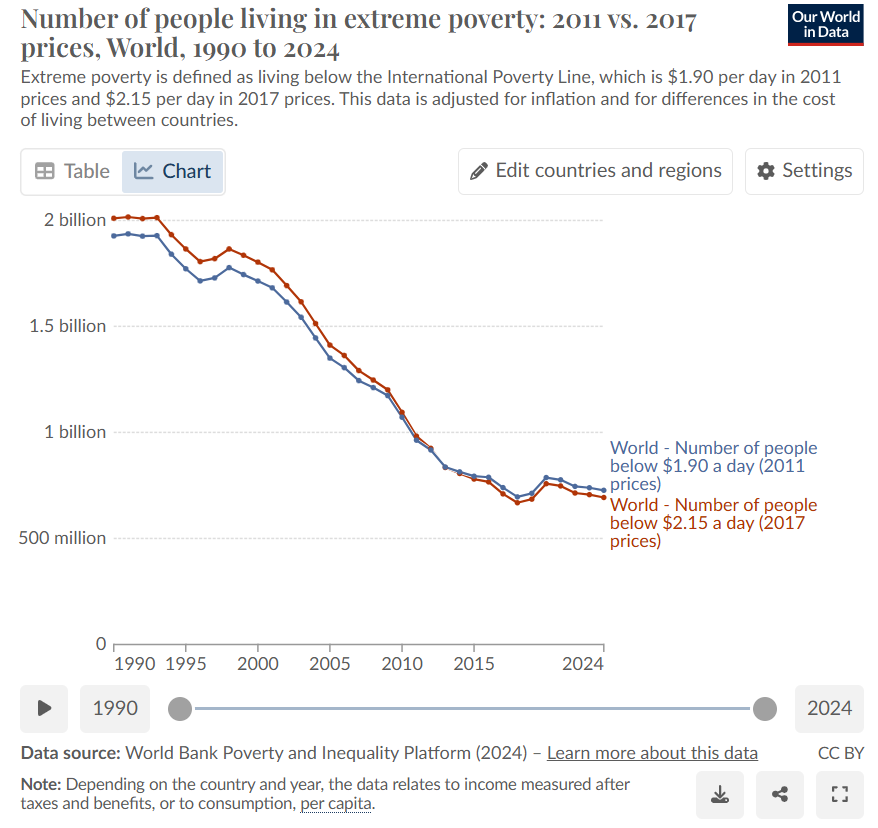
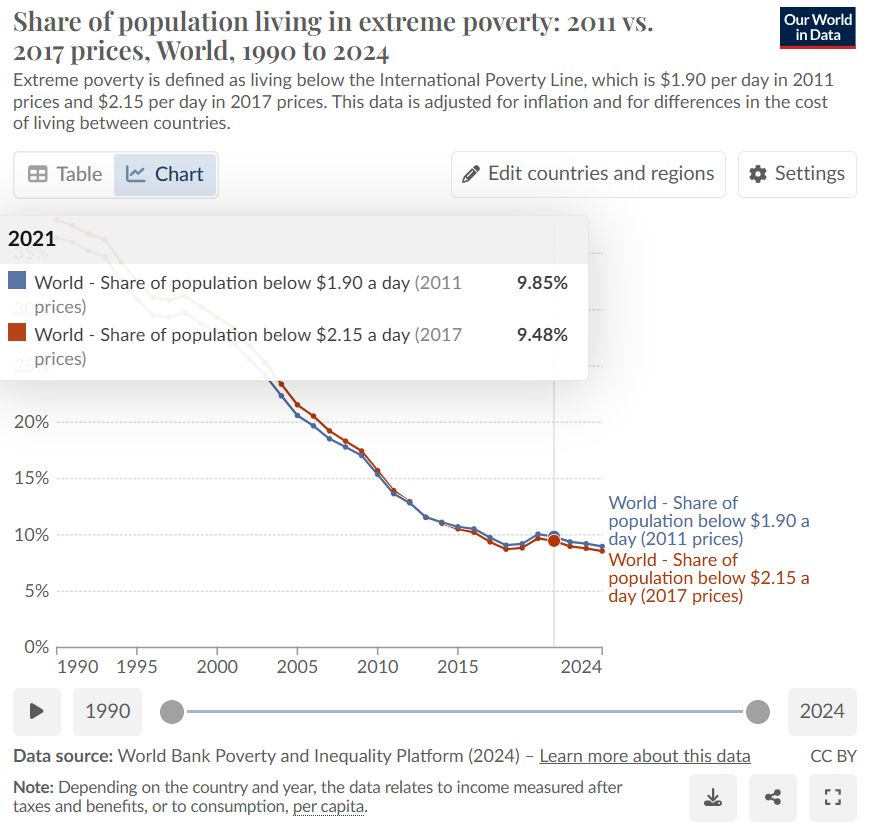
This continuity is reflected in the data: Overall the update only very modestly changes our understanding of the extent of extreme poverty globally. We see this in the two charts below that show the share and number of people in extreme poverty using the old and updated methodologies.
Estimates of the share of people living in extreme poverty globally for 2019 – the latest available year – are slightly lower using the updated methodology: 8.4% as compared to 8.7%. That translates to 20 million fewer people living in extreme poverty.
We also see a slightly faster decline in poverty over recent decades using the updated methodology. Looking back to the 1990s, estimates of the share in extreme poverty using the updated methodology are around 1.5% points higher – or around 80 million people.
Joe Hasell (2022) – “From $1.90 to $2.15 a day: the updated International Poverty Line” Published online at OurWorldinData.org. Retrieved from: ‘https://ourworldindata.org/from-1-90-to-2-15-a-day-the-updated-international-poverty-line’ [Online Resource]

